


In municipal wastewater treatment and industrial effluent treatment plants, aeration systems typically account for 50% to 70% of total plant energy consumption. As the core component of the aeration system, the disc diffuser directly determines oxygen transfer efficiency, blower power draw, and long-term maintenance costs. Yet in practice, many projects default to generic specifications without performing a structured selection process - leading to oversized blowers, uneven aeration patterns, and premature membrane replacement. This article provides a systematic framework for disc diffuser selection, covering the six critical design parameters every engineer should evaluate, a reproducible five-step selection methodology, and a detailed case study from a 100,000 m3/day municipal plant upgrade.
1. SIX KEY DESIGN PARAMETERS BEFORE SELECTION
1.1 Air Flow Rate
Air flow rate is the primary selection parameter for any disc diffuser. Standard fine-bubble disc diffusers typically operate within a design range of 1 to 8 Nm3/h per unit, with the sweet spot for most municipal applications falling between 2 and 4 Nm3/h. Operating below 1 Nm3/h results in insufficient turbulence to keep solids in suspension and may fail to meet biological oxygen demand. Conversely, exceeding 8 Nm3/h produces coarse, fast-rising bubbles that reduce oxygen transfer efficiency by 15% to 25% and can cause mechanical stress leading to membrane tearing at the perforation points. A practical rule of thumb is to select a flow rate in the lower-to-mid range of the operating window, reserving the upper range for peak-load capacity margin rather than continuous operation.
1.2 Bubble Size and Standard Oxygen Transfer Efficiency (SOTE)
Fine bubble disc diffusers generate bubbles with diameters of 1 to 3 mm, achieving a Standard Oxygen Transfer Efficiency (SOTE) of 25% to 35% per meter of submergence in clean water. This is approximately 40% to 60% higher than coarse-bubble alternatives, which translates directly into lower blower horsepower and reduced energy bills. For high-strength industrial wastewater with elevated COD concentrations or low-temperature operating conditions (below 10 degrees C), EPDM membrane disc diffusers with finer pore sizes and larger specific surface area are preferred, as they compensate for the reduced oxygen mass transfer coefficient at lower temperatures. Understanding that SOTE is not a fixed number - it varies with airflow rate, submergence depth, and membrane condition - is essential for realistic system sizing.
1.3 Coverage Area and Layout Density
Each disc diffuser typically covers a service area of 0.5 to 3 m2, depending on basin geometry, water depth, and the targeted oxygen distribution profile. The coverage area is not simply total basin floor area divided by diffuser count - it must account for the overlapping oxygen dispersion cones that form around each diffuser. For plug-flow basins, a critical design consideration is that diffuser density should decrease along the flow path: denser spacing at the inlet where organic load is highest, sparser toward the outlet where BOD has been substantially reduced. This graduated layout prevents over-aeration at the tail end while ensuring sufficient oxygen supply at the head of the basin, improving overall energy efficiency by 10% to 15% compared to uniform-grid layouts.
1.4 Water Depth and Backpressure
Every meter of water depth adds approximately 9.8 kPa of hydrostatic backpressure on the diffuser membrane and the blower system. While deeper basins improve oxygen transfer by increasing bubble-water contact time, they also demand higher discharge pressure from blowers. For installations in basins exceeding 6 meters in depth, reinforced base plates and thicker EPDM membranes (typically 2.0 to 2.5 mm) are recommended to prevent deformation, creep, or rupture under sustained pressure. The relationship between depth, SOTE, and energy cost is nonlinear - the incremental SOTE gain per additional meter of depth diminishes beyond approximately 7 meters, while blower power consumption continues to rise linearly. A cost-benefit analysis considering both capital and 10-year operating costs should guide depth selection.
1.5 Operating Temperature and Media Characteristics
Membrane material selection is dictated by the chemical and thermal environment of the aeration basin. EPDM (ethylene propylene diene monomer) is the industry standard for municipal wastewater, offering a broad operating temperature range of -40 degrees C to 130 degrees C, excellent resistance to aging and UV exposure, and competitive cost. However, for industrial wastewater streams containing oils, solvents, or aggressive chemicals, EPDM can swell and degrade within months. In these applications, silicone membranes or specially formulated oil-resistant EPDM compounds should be specified. PTFE-coated membranes offer additional chemical resistance for extreme environments, though at a higher unit cost. The table below summarizes key material selection criteria.
| Membrane Material | Temp. Range | Chemical Resistance | Best Application |
| EPDM | -40 to 130 deg C | Good (acids, alkalis); Poor (oils, solvents) | Municipal wastewater; general industrial |
| Silicone | -50 to 200 deg C | Excellent (oils, solvents) | Oily industrial effluent; chemical plants |
| PTFE-Coated EPDM | -20 to 150 deg C | Superior (acids, solvents, oxidizers) | Aggressive chemical wastewater; extreme pH |
1.6 Installation and Maintenance Configuration
The choice between fixed-bottom and liftable (retrievable) installation is a strategic decision that affects both capital expenditure and long-term operational flexibility. Fixed-bottom installations using threaded connections or saddle clamps on submerged piping headers offer lower initial material costs and simpler construction. However, any membrane inspection or replacement requires complete basin dewatering - a costly and time-consuming process that can take a treatment train offline for 3 to 7 days. Liftable systems, which mount diffusers on removable frames or articulated arms, enable individual diffuser maintenance without dewatering. While the initial investment is typically 15% to 25% higher, this configuration significantly reduces long-term maintenance costs, especially in plants with limited redundancy or continuous discharge permit requirements. For plants with more than 500 diffuser units, a liftable configuration often achieves a payback period of under 3 years through reduced maintenance downtime alone.

2. THE FIVE-STEP SELECTION METHOD
A disciplined selection process ensures that the diffuser system is neither undersized (leading to effluent non-compliance) nor oversized (wasting capital and energy). The following five-step method is derived from activated sludge design guidelines and has been validated across over 50 municipal and industrial projects.
Step 1: Calculate Standard Oxygen Transfer Rate (SOTR)
Begin with the influent characterization: COD, BOD5, and ammonia nitrogen concentrations, together with the required effluent standards. The SOTR (kg O2/h) under standard conditions is calculated from the Actual Oxygen Requirement (AOR) divided by correction factors. AOR must account for both carbonaceous BOD removal and nitrification oxygen demand - approximately 4.6 kg O2 per kg of NH3-N oxidized. During peak loading events (typically wet-weather flows), the oxygen demand can surge by 30% to 50%, and the diffuser system must be designed to handle these peaks without exceeding the upper flow limit per diffuser.
Step 2: Determine Standard Oxygen Transfer Efficiency (SOTE)
Begin with the diffuser manufacturer's clean water SOTE curve and apply correction factors for real-world conditions. Three critical corrections must be applied: temperature correction (warmer water holds less dissolved oxygen, reducing the driving force for transfer), salinity correction (dissolved salts alter bubble coalescence behavior), and the alpha factor (the ratio of process-water to clean-water oxygen transfer coefficients, typically 0.4 to 0.8 depending on MLSS concentration and surfactant levels). A well-characterized alpha factor is essential - overestimating it by 0.1 can lead to a 15% to 20% undersizing of the aeration system.
Step 3: Calculate Total Air Demand
With SOTR and corrected SOTE established, total air demand is given by the relationship: Total Air Demand (Nm3/h) = SOTR / (0.28 x SOTE), where 0.28 represents the empirical mass fraction of oxygen in air (0.21 volumetric fraction multiplied by the density ratio at standard conditions). This calculation yields the blower sizing requirement. It is prudent to add a 10% to 15% safety factor on total air demand to account for membrane fouling that occurs gradually between cleaning cycles, which typically reduces SOTE by 5% to 15% over a 12- to 18-month operating period.
Step 4: Determine Number of Diffusers and Layout
Divide the total air demand (including safety factor) by the design flow rate per diffuser to obtain the required number of units. The layout pattern - grid, staggered, or strip - is then determined by basin dimensions, inlet/outlet positions, and hydraulic modeling results. For rectangular basins exceeding 10 meters in width, a dual-roll pattern with diffusers placed along two longitudinal headers creates helical flow patterns that improve mixing and solids suspension. Diffuser spacing in the direction perpendicular to flow should be 0.5 to 1.5 meters, with closer spacing near basin walls to prevent dead zones. CFD simulation, while not mandatory for smaller projects, is strongly recommended for basins with unusual geometry or mixed-liquor recirculation loops.
Step 5: Verification and Optimization
The final step is a system-level verification. Confirm that the air-to-water ratio falls within 4:1 to 8:1 - ratios below 4:1 may indicate insufficient mixing, while ratios above 8:1 suggest potential over-aeration and wasted energy. Verify that the diffuser flux rate (airflow per unit floor area) is within the recommended range of 3 to 12 Nm3/h per m2 of basin floor. Adjust the flow rate per diffuser, add standby units, or modify the layout grid as needed. At this stage, it is also good practice to run a what-if scenario: if one blower is taken offline for maintenance, can the remaining diffusers maintain at least 60% of design oxygen transfer? If not, consider installing a standby blower or adding 5% to 10% more diffuser capacity.
| Selection Step | Key Formula / Parameter | Common Pitfall |
| 1. Calculate SOTR | AOR + peak load factor | Ignoring nitrification oxygen demand |
| 2. Determine SOTE | Clean-water SOTE x alpha x temp | Overestimating alpha factor |
| 3. Total Air Demand | SOTR / (0.28 x SOTE) | No safety factor for membrane fouling |
| 4. Diffuser Count & Layout | Air demand / flow per diffuser | Uniform spacing in plug-flow basins |
| 5. Verification | Air-water ratio 4:1 to 8:1 | Skipping single-blower-failure scenario |
3. APPLICATION CASE STUDY: MUNICIPAL WWTP UPGRADE
Project Background
A 100,000 m3/day municipal wastewater treatment plant in eastern China had been operating with tubular diffusers for 8 years. Performance audits revealed a progressive decline in oxygen transfer efficiency - SOTE had dropped from an original 28% to approximately 18%, forcing blowers to operate at higher RPM and driving annual electricity consumption well above design benchmarks. The upgrade mandate was twofold: improve effluent quality from Grade 1A to quasi-Class IV surface water standards (TN less than 10 mg/L, NH3-N less than 1.5 mg/L), while simultaneously reducing aeration energy consumption by at least 25%.
Design Solution
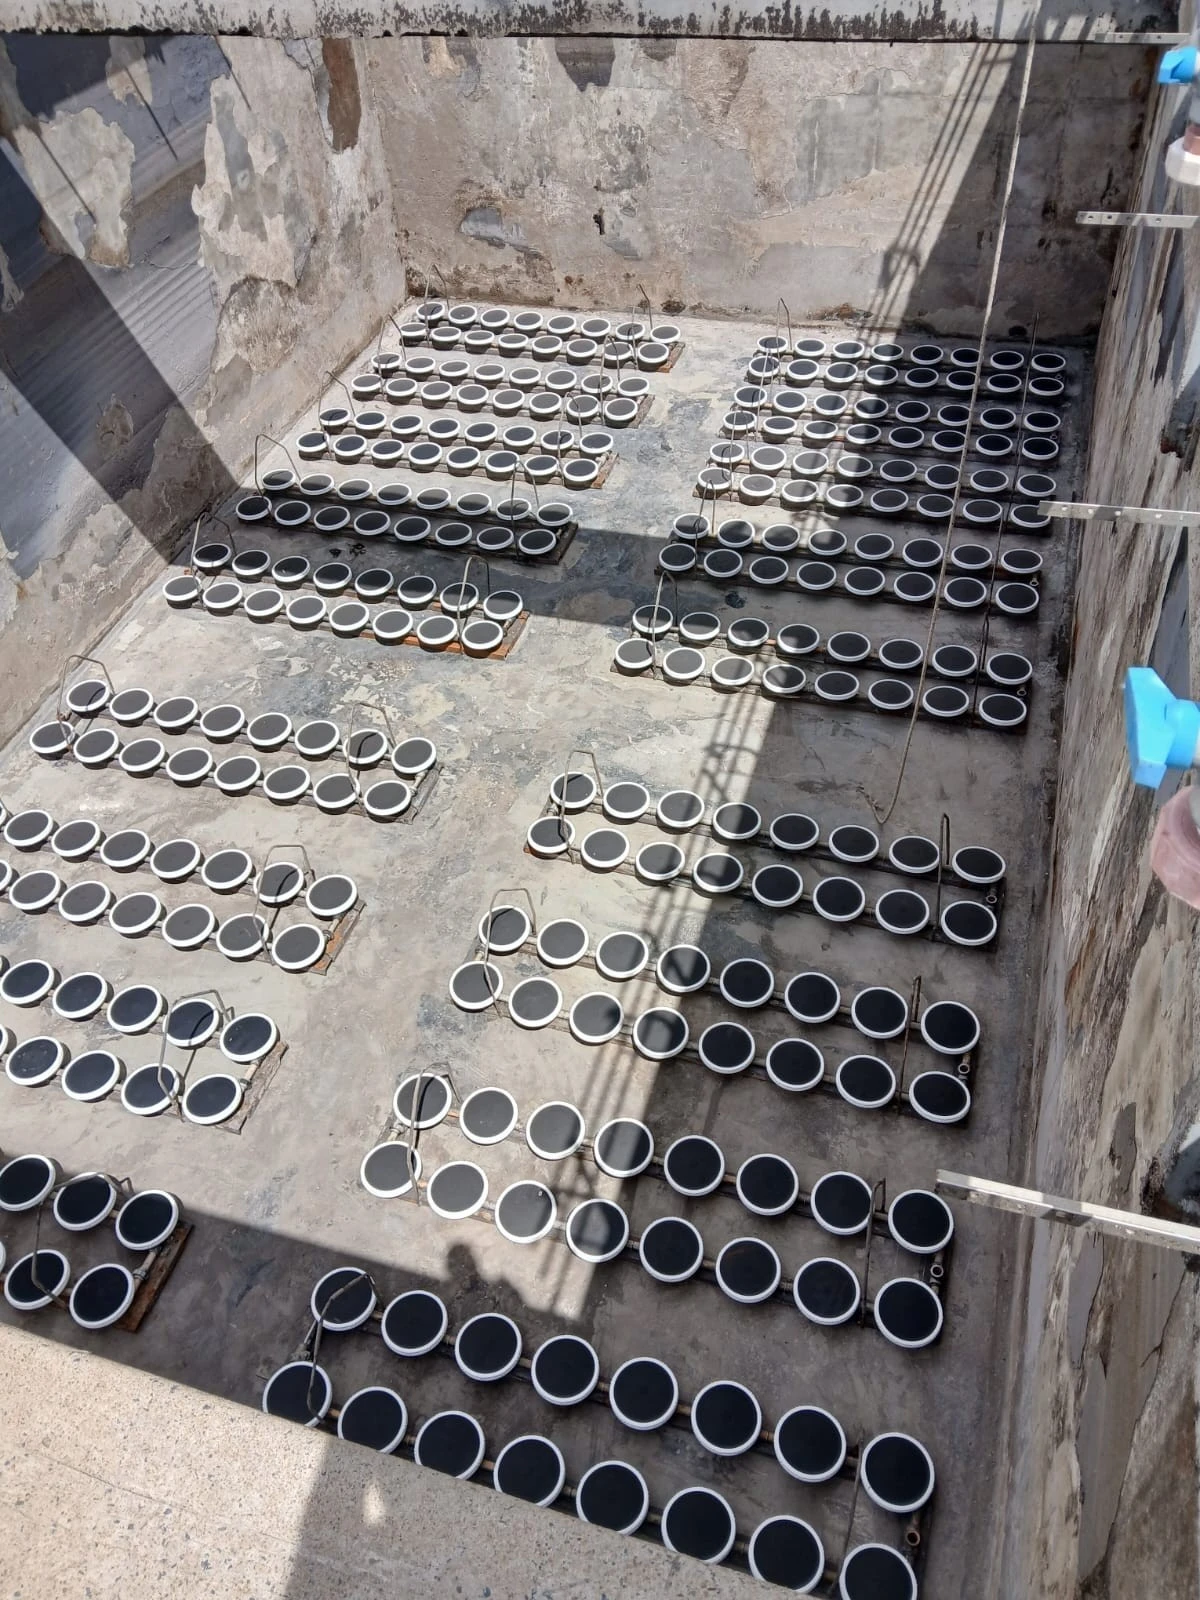
The engineering team selected 4,800 units of 325 mm diameter EPDM membrane disc diffusers, configured at a design flow rate of 3 Nm3/h per unit. The layout density was set at 2.8 units per m2 of basin floor area, arranged in a graduated pattern along four parallel plug-flow channels. The diffusers were installed on a liftable frame system at a water depth of 6.5 meters, enabling individual membrane replacement without basin dewatering. Reinforced EPDM membranes with a thickness of 2.2 mm were specified to handle the sustained backpressure of approximately 64 kPa at the 6.5-meter operating depth.
Operational Results
After 12 months of stable operation, the plant reported significant improvements across all key performance indicators: SOTE reached 32%, a 78% improvement over the degraded tubular system and 4 percentage points above the original design expectation. The air-to-water ratio was reduced from 6.5:1 to 4.2:1, bringing it into the optimal efficiency range and eliminating the over-aeration that had characterized the previous configuration. Most significantly, blower power consumption decreased by 38%, generating annual electricity savings of 1.8 million kWh - equivalent to approximately 1,200 tonnes of CO2 emissions avoided per year. The estimated return on investment period was 18 months, after which the savings flowed directly to the plant's operating budget.
| Performance Metric | Before Upgrade | After Upgrade | Improvement |
| SOTE (%) | 18 (degraded) | 32 | +78% |
| Air-to-Water Ratio | 6.5:1 | 4.2:1 | -35% |
| Blower Power (kW) | 1,380 | 856 | -38% |
| Annual Electricity (kWh) | 12.1 million | 10.3 million | Saved 1.8M kWh/yr |
| Effluent NH3-N (mg/L) | 5.0 (Grade 1A) | less than 1.5 | Quasi-Class IV |
Key Takeaways
This case demonstrates that diffuser selection is not a commodity decision - it is an engineering optimization problem with significant financial and environmental consequences. The graduated layout pattern alone contributed an estimated 8% of the total energy savings by eliminating over-aeration in low-load zones. The liftable installation added approximately 18% to the upfront equipment cost but is projected to save over $120,000 in maintenance-related downtime costs over a 10-year design life. The 18-month ROI is consistent with well-executed diffuser upgrades globally, where the payback period typically ranges from 12 to 30 months depending on local electricity tariffs and plant scale.
CONCLUSION
Proper disc diffuser selection is a systematic, multi-variable engineering process that must account for water quality characteristics, basin geometry, operational mode, and 10-to-20-year lifecycle costs - not just the upfront equipment price. Projects that shortcut the selection process by specifying generic diffuser quantities and layouts routinely suffer from uneven aeration, accelerated membrane wear, and energy overconsumption that far exceeds any initial cost savings. We recommend engaging with technical suppliers during the feasibility or preliminary design phase, well before procurement specifications are finalized, to leverage manufacturer-specific performance data and application experience. For mission-critical or large-scale projects, clean water oxygen transfer tests and CFD simulations provide quantitative verification that the selected diffuser configuration will meet both treatment and energy targets under real operating conditions. For specific project inquiries and tailored selection proposals, please contact our technical engineering team.
Get Expert Disc Diffuser Support for Your Project
Our technical team provides free selection assistance, CFD layout modeling, and lifecycle cost analysis tailored to your basin configuration and treatment targets.