


Designing the Electrical Control System for MBBR Integrated Wastewater Treatment Units
A modular, intelligent approach to reliable automation for decentralized MBBR plants | June 2026
For MBBR-based wastewater treatment systems to function reliably in decentralized applications -- rural villages, highway service areas, small communities -- the electrical control system must do more than switch pumps on and off. It must protect equipment, adapt to changing loads, minimize operator intervention, and communicate faults before they become failures. Understanding these design principles helps reduce downtime, extend equipment life, and meet tightening environmental standards.
This article discusses the practical design of electrical control systems for MBBR integrated equipment, covering hardware selection, electrical design, control logic programming (PLC), and remote monitoring solutions. Whether you are an equipment manufacturer, system integrator, or plant operator, these principles directly translate to lower operational costs and more reliable compliance.
Why Control System Design Matters
Rural and decentralized wastewater treatment faces unique challenges: limited on-site technical staff, wide variations in flow and load, and the need for high operational reliability with minimal maintenance. Conventional control systems that rely on manual operation or simple timer-based logic cannot meet modern treatment requirements, especially when nitrogen and phosphorus removal standards demand precise control of aeration, recirculation, and chemical dosing.
A well-designed electrical control system with PLC logic provides:
Automatic adaptation to influent fluctuations without human intervention
Energy efficiency through optimized aeration and pump scheduling
Equipment protection via overload, phase-loss, and dry-run detection
Fault diagnosis and remote alarm notification for rapid response
Compliance reporting through automated data logging
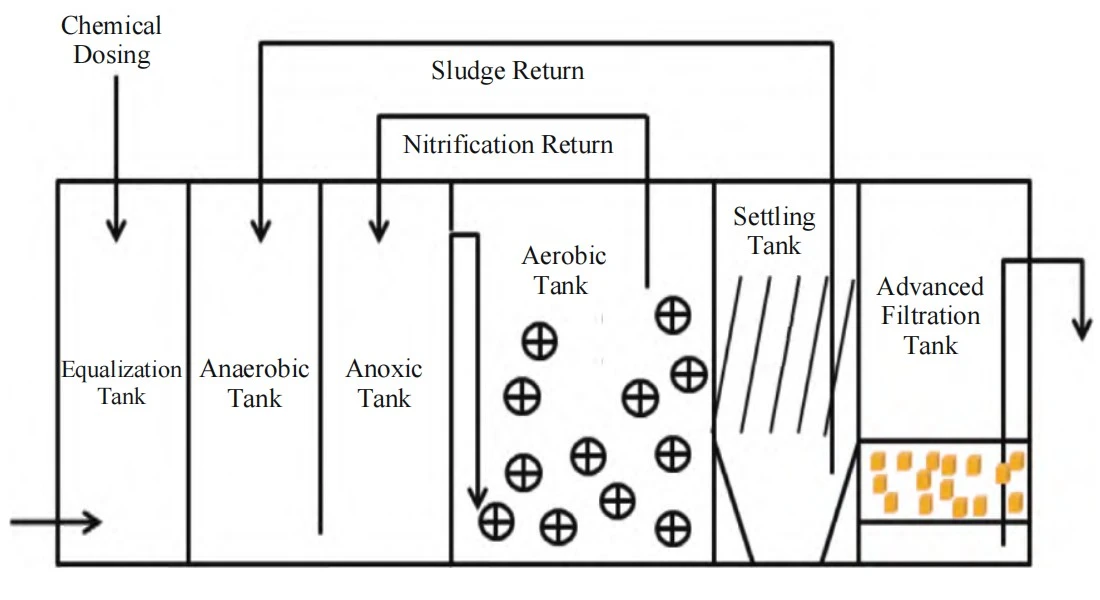
Figure 1: Control Panel for Integrated MBBR Equipment
1. System Architecture Overview
The control system architecture is divided into three layers:
Field Layer: Sensors (DO, pH, flow meters, level switches, temperature probes) and actuators (blowers, pumps, valves, chemical dosing pumps).
Control Layer: PLC (Programmable Logic Controller) with analog and digital I/O modules, executing control logic and processing field signals.
Supervision Layer: HMI (Human-Machine Interface) touch screen for local monitoring and operation, plus optional remote SCADA or cloud-based monitoring via 4G/5G router.
For small MBBR plants (50-500 m³/d), a compact PLC with integrated HMI is recommended. For larger plants or multi-unit installations, a modular PLC with distributed I/O provides better scalability.
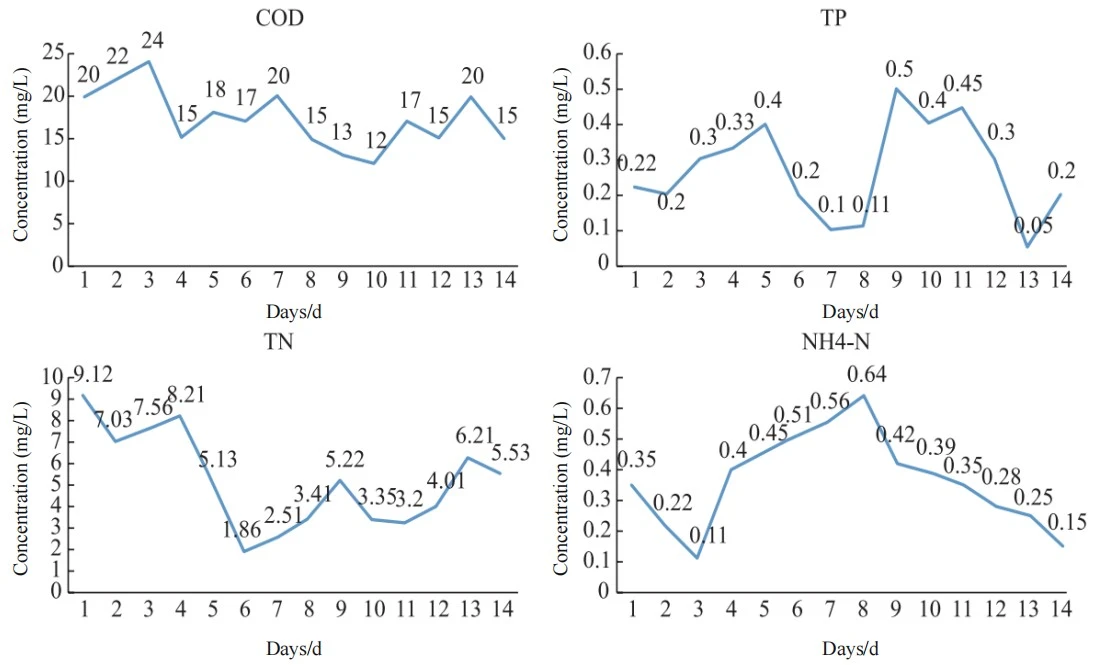
Figure 2: System Architecture Diagram
2. Hardware Selection Guide
2.1 Main Power Distribution
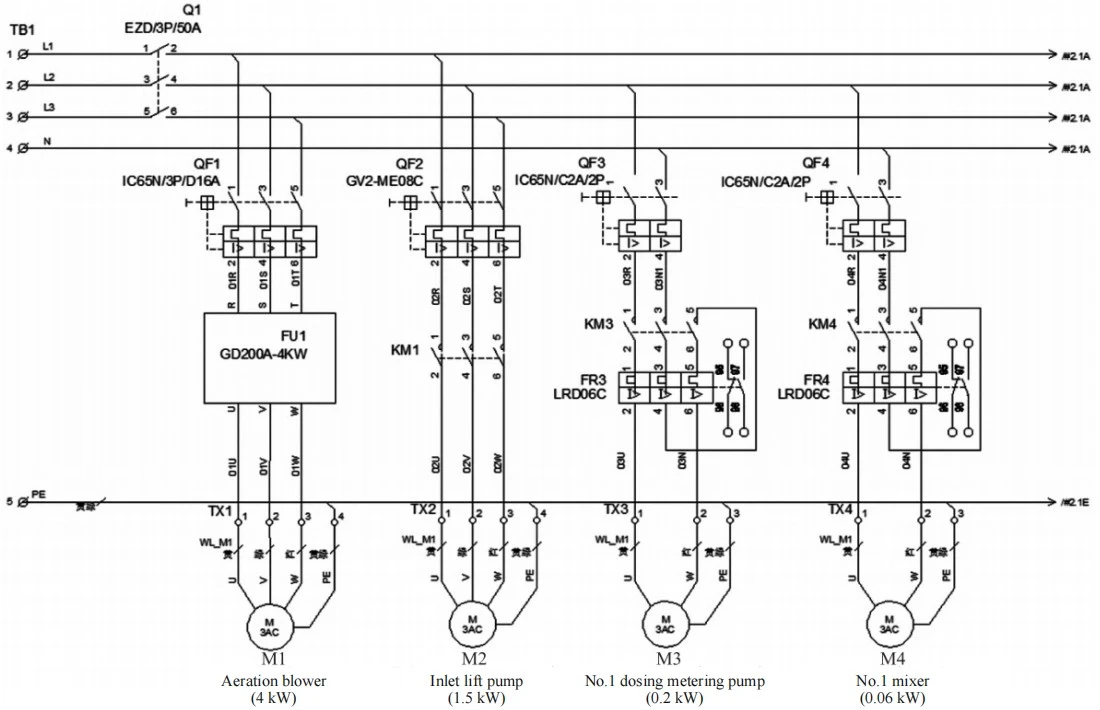
The incoming power supply must be protected by a main circuit breaker with appropriate interrupting capacity. Key design rules:
Main breaker rated at 125% of total full-load current
Motor branch circuits protected by motor circuit breakers (MCBs) with thermal and magnetic trip
Control power (24V DC) supplied by a DIN-rail switching power supply, sized at 150% of total control load
Emergency stop (E-Stop) circuit wired as a safety relay with manual reset, not software-dependent
Surge protection device (SPD) at the main incoming terminals for lightning-prone areas
2.2 PLC Selection Criteria
The PLC should be selected based on I/O count, communication requirements, and environmental conditions:
| Parameter | Recommended Specification |
| I/O Reserve | At least 20% spare capacity for future expansion |
| Analog Inputs | 4-20 mA for DO, pH, flow; 0-10V for level |
| Digital Outputs | Relay type for pumps/blowers (above 0.5A), transistor type for solenoid valves |
| Communication | Ethernet port for HMI/SCADA, RS-485 for VFD control (Modbus RTU) |
| Environmental | Operating temperature 0-55°C, conformal coating for humid/corrosive environments |
| Programming | Ladder diagram (LD) preferred for maintainability by local technicians |

Figure 3: HMI Main Monitoring Screen Example
2.3 HMI Requirements
A 7-inch or 10-inch touch screen HMI provides the local operator interface. The HMI must display:
Real-time process values (DO, pH, flow, tank levels)
Equipment status (run/stop/fault) with color coding: Green = Running, Red = Fault, Gray = Stopped
Alarm history with timestamp
Trend graphs for DO and flow rate (minimum 7-day history)
Manual override capability for each device (with password protection)
Control Panel Internal Layout and Wiring
2.4 VFD (Variable Frequency Drive) for Blowers
Blowers account for 50-70% of total energy consumption in MBBR plants. Using VFDs with PID control based on DO setpoint can reduce aeration energy by 20-35%. For MBBR applications, VFD selection criteria include:
Rated for continuous duty with 10% overload margin
Built-in PID controller with DO feedback (4-20 mA)
Automatic restart after power failure (flying start function)
Modbus RTU communication for PLC integration
EMC filter built-in to prevent interference with sensors
3. Control Logic Design
3.1 Main Control Sequence
The control program should follow a state-machine structure with these operational modes:
Start-Up Mode: Gradual equipment sequencing -- mixers first, then influent pump, then blowers at minimum speed. Prevents hydraulic shock and allows biofilm acclimation.
Normal Operation Mode: PID-based aeration control, timed sludge return, and level-based influent pumping. The DO setpoint is typically 2.0-3.0 mg/L for nitrification-dominant MBBR systems.
Low-Flow Mode (Night/Off-Peak): If influent flow drops below 30% of design, the system enters intermittent aeration mode (e.g., 30 min ON, 15 min OFF) to save energy while maintaining biofilm viability.
Storm/High-Flow Mode: When influent flow exceeds 120% of design, all equipment runs at maximum capacity and excess flow is diverted to an equalization tank or bypass.
Maintenance Mode: All equipment locked out via key switch; HMI displays maintenance checklist.
3.2 PID Aeration Control
The most critical control loop in an MBBR plant is the DO-based aeration control. The PID algorithm takes the DO sensor reading (process variable, PV), compares it to the setpoint (SP, typically 2.5 mg/L), and adjusts the VFD output frequency (control variable, CV) to minimize error.
The PID tuning should follow this approach:
Start with P-only (Kp = 0.5-1.0), observe oscillation period
Add Integral (Ti = 30-60 seconds) to eliminate steady-state error
Keep Derivative (Td) small or zero for wastewater applications (noisy DO signals can cause derivative kick)
Anti-windup: Limit integral accumulation when VFD reaches min/max frequency
The PID output should be updated every 1-2 seconds. Fast update rates can cause hunting; slow rates cause sluggish response.
3.3 Alarm and Fault Handling
Alarms are categorized into three severity levels:
| Level | Severity | Action | Example |
| 1 (Warning) | Non-critical | Log only, notify via HMI | DO slightly above setpoint for less than 5 min |
| 2 (Alarm) | Requires attention | HMI alarm + optional SMS/email | High water level in tank, blower VFD fault |
| 3 (Critical) | Immediate shutdown | HMI alarm + SMS + equipment stop | Blower thermal overload, pump dry-run, E-Stop activated |
All alarms must be latched (remain active until manually acknowledged) and timestamped with 1-second resolution.
3.4 Automatic Sludge Management
Sludge wasting is controlled by a timer with adjustable ON time and interval based on SRT calculation:
Operator sets target SRT (days) and MLSS concentration on HMI
PLC calculates daily waste volume: V_waste = V_tank x MLSS / (SRT x RAS_SS)
Sludge pump runs at timed intervals to approximate the calculated volume
This semi-automated approach bridges the gap between fully manual and fully automated sludge management.
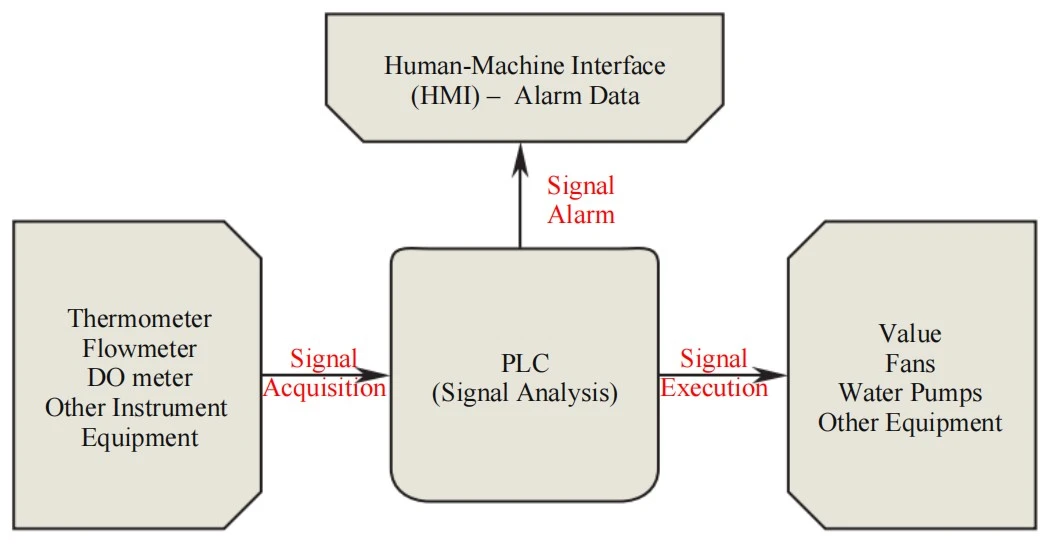
Figure 4: Control Logic Flowchart for MBBR Operation
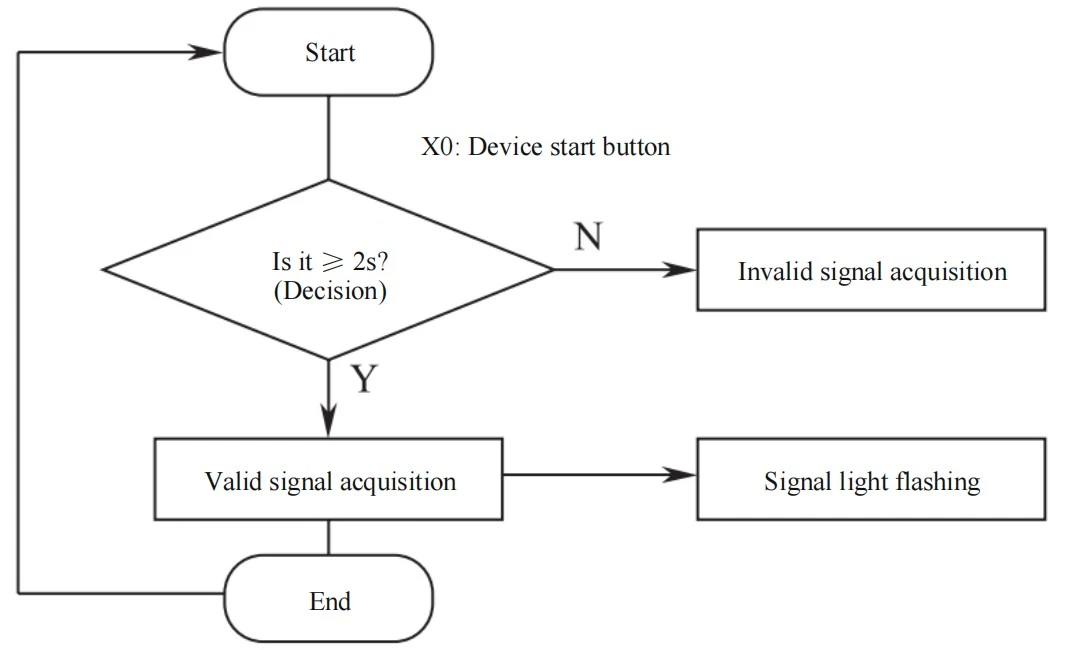
PLC Programming Interface and HMI Configuration
4. Remote Monitoring and IoT Integration
For decentralized plants where daily operator visits are impractical, remote monitoring is essential. A 4G/5G industrial router connected to the PLC's Ethernet port enables:
Real-time dashboard accessible via web browser or mobile app
SMS/WeChat alarm notifications for Level 2 and Level 3 alarms
Historical data trending (DO, flow, water quality parameters) stored in cloud database
Remote PLC program upload/download for troubleshooting and updates
Cybersecurity considerations include: VPN tunnel (not port forwarding), firewall enabled, default passwords changed, firmware kept updated, and access logging enabled.
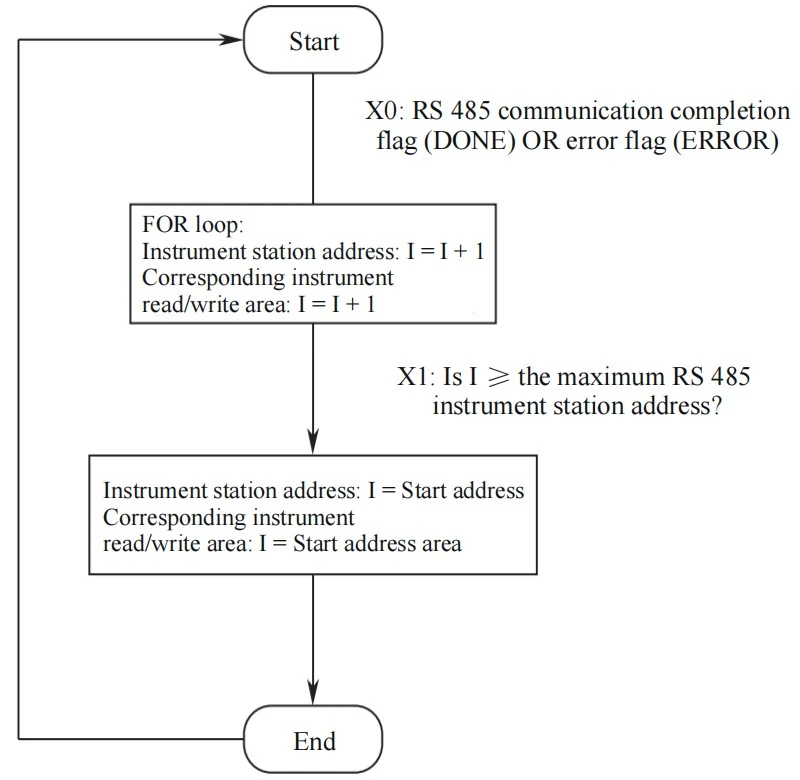
Remote Monitoring Dashboard and 4G/5G IoT Gateway Setup
5. Installation and Commissioning Checklist
Pre-energization: Verify all wiring against electrical schematics, check insulation resistance (minimum 1 MΩ at 500V DC), confirm ground resistance below 4Ω.
I/O Check: Force each digital output ON/OFF from the PLC to verify field device operation. Simulate 4-20 mA signals to verify analog input scaling.
Sensor Calibration: Calibrate DO sensor in air (100% saturation), verify pH with buffer solutions (4.01 and 7.00), calibrate flow meter against a known volume.
Functional Test: Run the system in manual mode through one complete cycle, then switch to auto mode and observe PID response to setpoint changes.
Documentation: Record all setpoints, PID parameters, and calibration data in the commissioning report. Take photographs of wiring and panel layout for future reference.
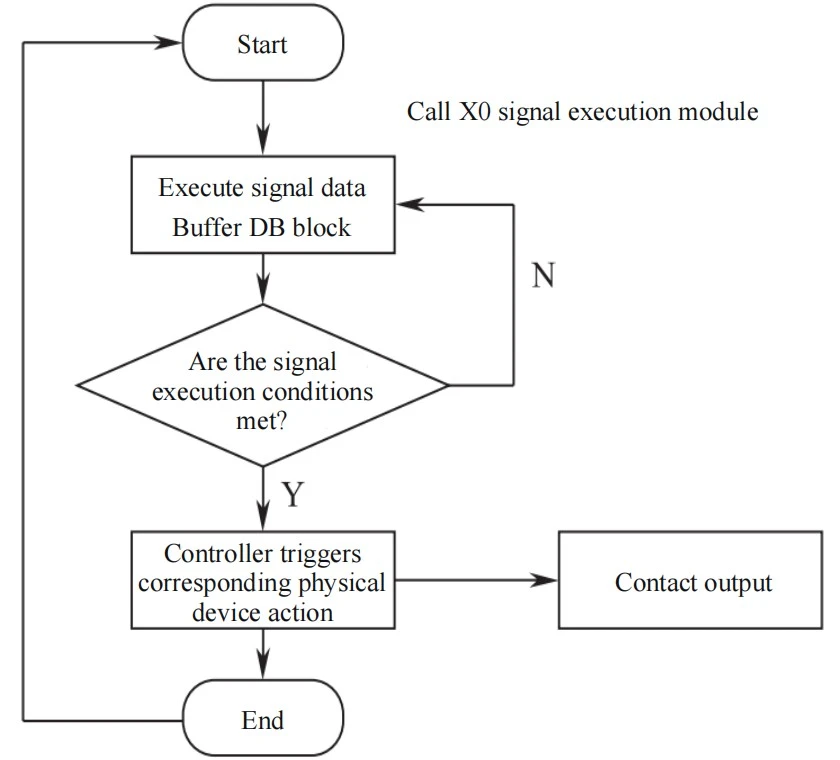
Figure 5: Commissioning and Testing on Site
6. Maintenance and Troubleshooting
6.1 Preventive Maintenance Schedule
| Frequency | Task |
| Daily | Check HMI for active alarms; verify DO and pH readings against handheld meters |
| Weekly | Inspect control panel for dust, moisture, or pest intrusion; verify cooling fan operation |
| Monthly | Test E-Stop function; verify backup battery voltage (greater than 3V for PLC); clean or replace panel air filter |
| Quarterly | Tighten all power terminals (torque to specification); verify VFD parameters against backup file; test alarm notification (SMS/email) |
| Annually | Full PLC program backup; replace cooling fans; calibrate all sensors; update firmware if applicable |
6.2 Common Faults and Diagnosis
| Symptom | Possible Cause | Action |
| Blower VFD trips on overcurrent | Clogged air filter or diffuser fouling | Check and clean air filter; inspect diffusers |
| DO reading unstable | Sensor membrane fouled or depleted electrolyte | Clean or replace sensor cap; calibrate |
| Level sensor false reading | Foam or floating debris interfering | Install stilling well; clean sensor face |
| PLC communication loss | Loose Ethernet cable or IP conflict | Check physical connection; verify IP settings |
| HMI screen unresponsive | Power supply undervoltage or screen failure | Measure 24V DC supply; replace if stable |

On-Site Control System Maintenance and Inspection
7. Conclusion
A properly designed electrical control system is as critical to MBBR treatment performance as the biological process itself. Key design principles include: modular hardware architecture for scalability, PID-based DO control with VFD for energy efficiency, multi-level alarm management with remote notification, semi-automated sludge management, and IoT integration for decentralized operation.
For equipment manufacturers and system integrators, adhering to these design guidelines reduces field failures, lowers warranty costs, and improves end-user satisfaction. For plant operators, understanding the control logic enables better troubleshooting, more efficient operation, and extended equipment life.

Figure 6: Complete Integrated MBBR Treatment Unit Installed at Site
Need Reliable Clarification for Your MBBR System?
At Juntai Plastic, we offer complete MBBR integrated treatment solutions including pre-engineered control systems with PLC/HMI, remote monitoring, and full commissioning support. Pair your MBBR system with our high-efficiency PVC tube settlers for maximum treatment capacity in a compact footprint.